We observe the phenomena of electromagnetic waves from a transmitting antenna to a receiver.
Equipment:

-Oscilloscope
-Oscillator
-BNC adapter (point receiver)
-Copper wire (antenna)
-Meter stick
Procedure:
On the oscillator we dialed a frequency of 30kHZ. We changed the time/division on the oscillascope and the voltage/division until we could see a signal on the screen.
To verify that the signal we saw on the oscilloscope was generated by the antenna we performed the following tests:
1. Moving the antenna closer made the wave amplitude larger.
2. Moving the antenna farther made the wave amplitude smaller.
3. Not moving the antenna kept the wave amplitude the same.
We then proceeded to measure the amplitudes at certain equal intervals of distance from the receiving antenna to observe how the wave amplitude varied across this range.
Data/Calculations:
Below is a table containing the data we gathered in this experiment.
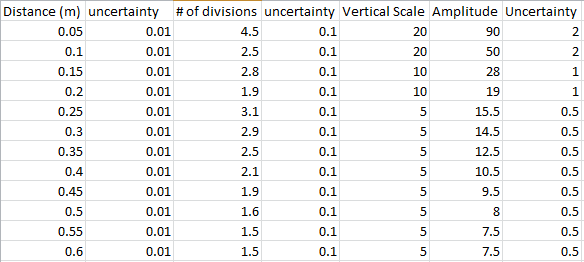

The first graph is the data fitted with the function A/R while the second one fits the data with A/R^2. The first graph appears to fit the data most accurately.


We would expect 1/r to fit well if the transmitter were a point charge, but because this is simply not true (our transmitter was a copper wire with a certain length). This
No comments:
Post a Comment